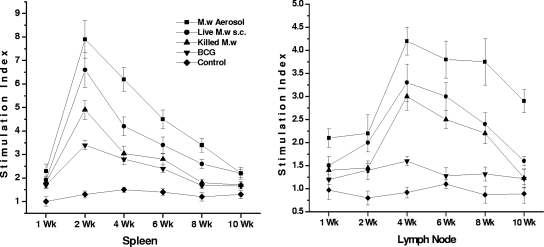
FIG. 6.
Kinetics of immune responses in the spleen and lymph nodes. M. tuberculosis Ag-specific lymphocyte proliferation at different time points is shown. Data are expressed as the mean ± SEM (n = 4 mice per group at each time point). The stimulation index is the counts per minute of Ag-stimulated cells divided by the counts per minute of unstimulated cells.

