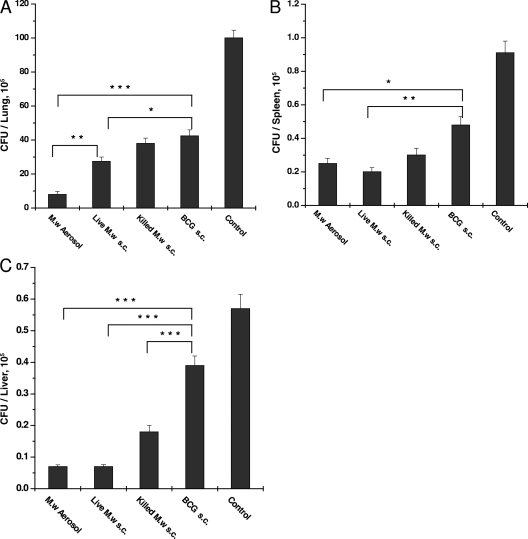
FIG. 8.
Bacterial loads in the lungs (A), spleens (B), and livers (C) of different groups of immunized and control mice at 12 weeks after challenge with M. tuberculosis H37Rv. Bacterial loads in four individual mice per group were determined, and the results of one of two similar experiments are shown. *, P < 0.05; **, P < 0.01; ***, P < 0.001.

