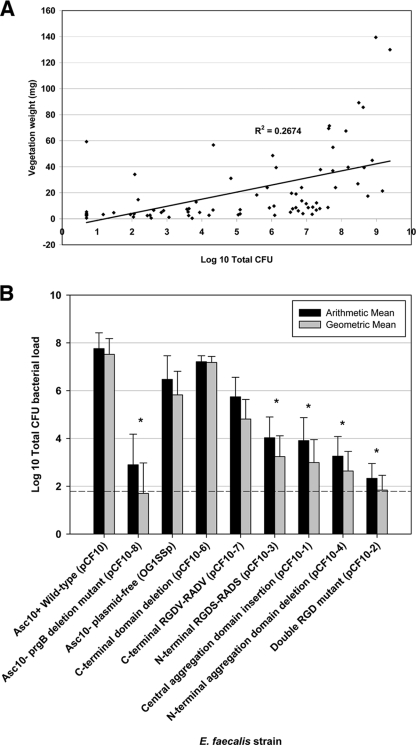
FIG. 5.
(A) Plot of vegetation bacterial load (total CFU) versus vegetation weight in a rabbit endocarditis model. E. faecalis cells expressing Asc10 mutant derivatives (2 × 10⁹ CFU) were injected intravenously after catheter placement in the carotid artery for 2 h; the catheter was removed prior to microbe injection. All vegetations on the aortic valve of each rabbit were pooled to obtain the vegetation weight and bacterial load. When no vegetations were found, the valves were removed and plated to determine the valve bacterial load. The low R2 value (0.27) indicates that there is no correlation between the sets of values. (B) Arithmetic and geometric mean vegetation bacterial loads in the rabbit endocarditis model, expressed as log10 total CFU. The dashed line indicates the minimum level of detection (1.93 log10 total CFU). *, P ≤ 0.01 for a comparison with the wild-type Asc10+ strain.

