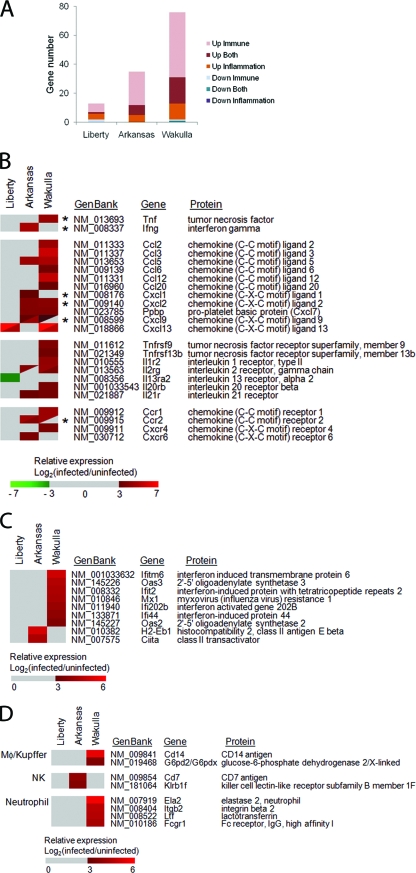
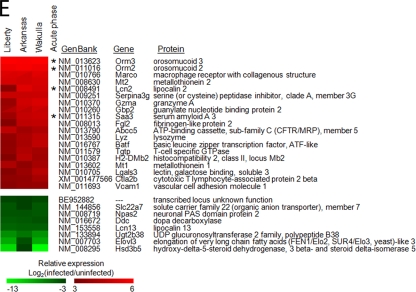
FIG. 3.
Expression of cytokine and chemokine genes in E. chaffeensis-infected livers. (A) Numbers of mouse genes belonging to immune and/or inflammatory response category (by functional annotation tool of DAVID Bioinformatics Resources) differentially expressed by E. chaffeensis infection. (B to E) The heat maps show relative expression in log2 values (infected/uninfected). A tile with a diagonal line shows two distinct probes for the same gene. (B) Differentially expressed cytokine and chemokine genes and their receptor genes. Asterisks indicate genes confirmed by RT-PCR (see Fig. 4). (C) Differentially expressed IFN-inducible genes. (D) Differentially expressed genes encoding cell markers. (E) Commonly upregulated (red) and downregulated (green) genes in mice infected with three E. chaffeensis strains (see section I in Fig. 2). Genes with the highest average ratios are shown from the top. Asterisks indicate acute-phase proteins. Gray tile in panels B, C, and D indicates the ratio under the threshold or no significant difference between infected and uninfected livers.


