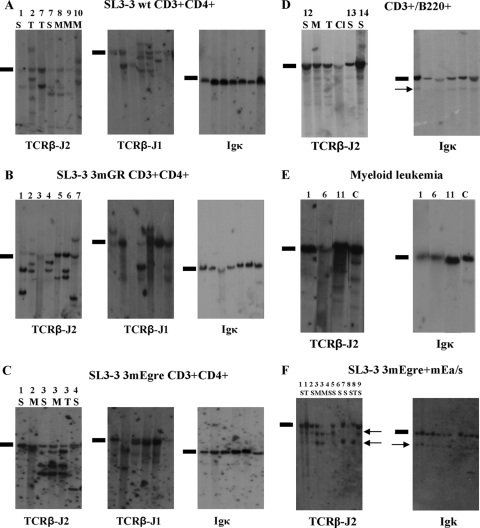
FIG. 2.
Southern blot analysis of genomic DNA extracted from SL3-3 3mEgre-, SL3-3 3mGR-, and SL3-3 wt-induced tumors of distinct types. (A) DNA from SL3-3 wt-induced T-cell tumors cleaved with HindIII and hybridized with the Igκ, TCR-J1, and TCR-J2 probes. Results are shown for seven tumors from six different mice diagnosed as T-cell lymphomas by flow analysis. (B) Hybridizations with TCRβ-J2, TCRβ-J2, and Igκ of HindIII-digested DNA from seven SL3-3 3mGR-induced tumors. (C) Six SL3-3 3mEgre-induced tumors characterized with the common T-cell lymphoma phenotype from four mice. S, spleen; M, mesenteric lymph node; T, thymus. (D) Tumors from three SL3-3 3mEgre-infected mice diagnosed with the CD3+ B220+ phenotype by flow analysis. Cl, Cervical lymph node. (E) Tumor samples from SL3-3 3mEgre-infected mice characterized with myeloid leukemia (ML) by histopathology. Lane 1, ML with maturation; lanes 6 and 11, ML without maturation. C, control spleen tissue from NRMI mock-infected mice. (F) Results for 10 SL3-3 3mEgre+mEa-injected mice; the arrows mark the weak rearrangements. Note that the rearrangement bands are the same size for all tumor samples, and this consistent pattern was not observed in the other series. The mice are numbered according to latency, with the first terminated mice having the lowest number. Black bars indicate the positions of the unrearranged genomic bands.

