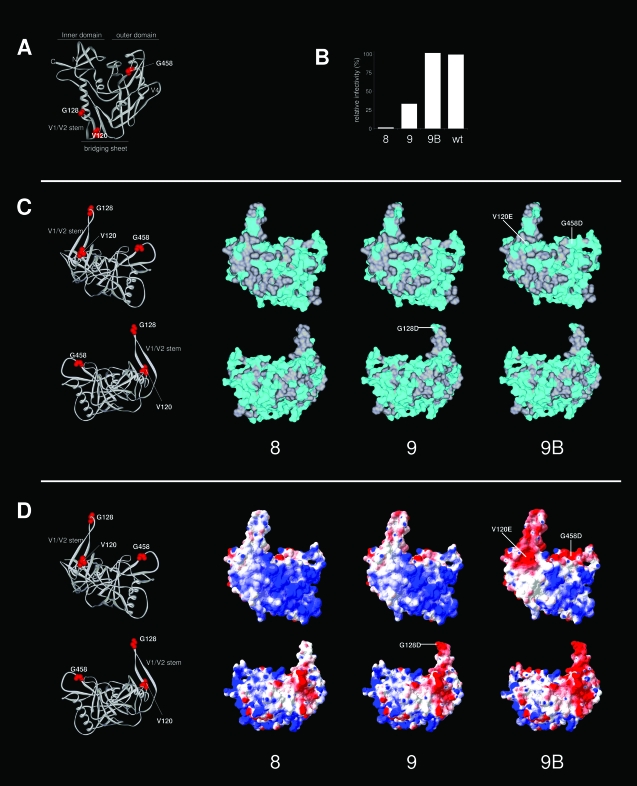
FIG. 9.
Surface analysis of variants 8, 9, and 9B. (A) Locations of the mutations and substitutions (residues 120, 128, and 458) on the 3-D structure of gp120 (same view as in Fig. 1B, top left panel). (B) Relative Env function of variants 8, 9, and 9B compared to that of the wt (based on the data depicted in Fig. 5). (C) Analysis of surface hydrophobicity. The top panels present a view similar to that shown in Fig. 1B (top right panel). The lower panels show gp120 rotated over the z axis by 180°. These perspectives provide good views on both sides of the V1/V2 stump. The surface associated with nonpolar residues is indicated in gray, and the surface associated with polar residues is in cyan. Mutations and substitutions are indicated. The LAI gp120 core and variant cores were modeled by SWISS-MODEL and drawn using Viewerlite. (D) Analysis of electrostatic surface potential. Electrostatic surface potentials were calculated and rendered using Deepview (red, acidic; blue, basic). The mutations and substitutions that are responsible for the changes in the electrostatic surface potential are indicated. Note that we underestimated the polar surface of gp120, since we only considered the surface associated with protein, not with carbohydrate.

