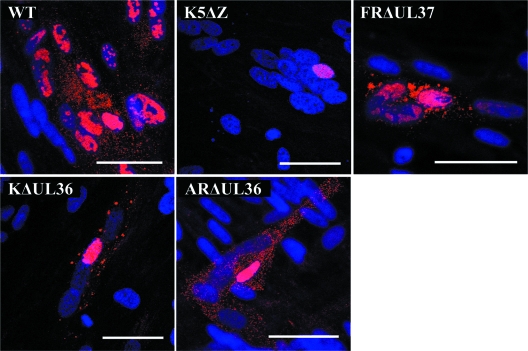
FIG. 5.
Capsid distribution in infected syncytia. Replicate monolayers of HFFF2 cells were infected and induced to form syncytia as described in the legend to Fig. 4. Viral DNA was visualized by FISH using Cy3-labeled probe (red), and nuclei were stained with DAPI (blue). Bars, 50 μm in all panels.

