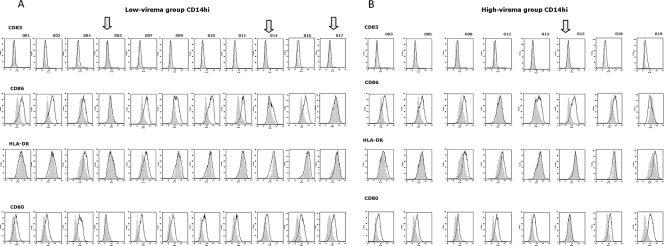
FIG. 6.
Individual pattern of activation in CD14hi cells. The expression of CD80, CD83, CD86, and HLA-DR in PBMCs was analyzed on fixed cells by using a FACScalibur flow cytometer, and data analysis was carried out using the FlowJo software program. PBMCs were gated for CD14dim positivity. The results of a representative experiment are shown; the shaded curve represents the baseline data for untreated cells. (A) Expression of markers in low-viremia group. (B) Expression of markers in high-viremia group. In each panel, the arrow indicates the samples with no induction of expression.

