FIG. 8.
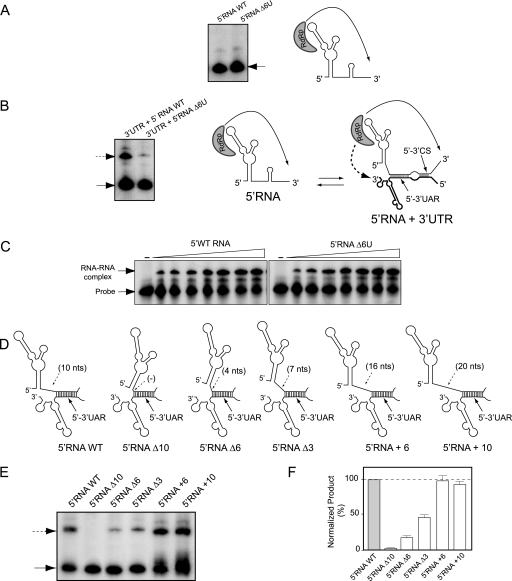
Role of the region between SLA and the 5′UAR in viral RNA synthesis. (A) In vitro RdRp activity of the recombinant NS5 for the first 160 nucleotides of the DENV genome WT or the mutant Δ6U as a template (5′RNA WT or 5′RNA Δ6U, respectively, as indicated above the gel). The radiolabeled RNA products were analyzed with denaturing 5% polyacrylamide gels. The arrow indicates the mobility of the product. On the right, a schematic representation of the initiation process is shown. (B) The efficiency of trans initiation polymerase activity depends on the oligo(U) track. The 5′RNA WT or the 5′RNA Δ6U mutant (160 nucleotides) was incubated with the WT 3′UTR molecule (458 nucleotides) and the viral polymerase. The radiolabeled products were analyzed with denaturing 5% polyacrylamide gels, as previously described (2, 11). The arrows indicate the mobilities of the two products. On the right, a schematic representation of the interaction of the RNA molecules representing the 5′ and 3′ ends of DENV RNA and the viral polymerase initiating RNA synthesis at the 3′ end of the template is shown. The hybridized 5′-3′UAR and 5′-3′CS are also shown. (C) RNA mobility shift assays showing the interaction between the 3′SL WT probe and the 5′RNA WT or 5′RNA Δ6U, as indicated at the top. The mobilities of the 3′SL probe and the RNA-RNA complex are indicated on the left. (D) Schematic representation of the hybridized 5′- and 3′-terminal regions of the viral genome for the WT and the mutants with deletions or insertions in the SLA-5′UAR spacer region: 5′RNAΔ10, 5′RNAΔ6, 5′RNAΔ3, 5′RNA+6, and 5′RNA+10. (E) Efficiency of trans initiation polymerase activity for different 5′RNA molecules. The 5′RNA molecules described for panel D were used for the trans initiation assay. The products were analyzed as described above. (F) The two radiolabeled products obtained in panel E were quantified, and the products obtained by trans initiation are expressed relative to the amount of product obtained by cis initiation for each mutant and referred to as percentages relative to WT levels [(3′RNA value/5′RNA value) × (5′RNA WT value/3′RNA WT value) × 100]. Error bars indicate the standard deviations of results from three independent experiments.

