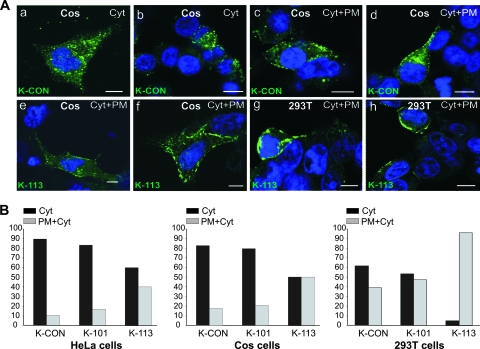
FIG. 3.
K113 Gag proteins accumulate at the plasma membrane. (A) Representative example of staining pattern of cells expressing K-CON and K-113 Gag. Cells were fixed at 24 h posttransfection and processed as described in Materials and Methods. HERV-K Gag is in green, while nuclei (DAPI) are in blue. Gag is visible as dispersed dots in the cytoplasm (Cyt) or in the cytoplasm and the plasma membrane (Cyt+PM) of transfected cells. The majority of cells expressing K113 show accumulation of Gag staining at the plasma membrane. Panels a to f show representative examples of experiments performed in Cos cells, while panels g and h show 293T cells. Bars, 10 μm. (B) Quantitation of Gag staining pattern in confocal microscopy of HeLa, Cos and 293T cells expressing K-CON, K-101, and K-113 Gag at 24 h posttransfection. The graph represents the number of cells in which Gag proteins display a staining dispersed in the cytoplasm (Cyt) versus cells showing both cytoplasmic and intense plasma membrane staining (PM+Cyt), as shown in panel A. Approximately 100 cells were randomly chosen in each experiment. Data are averages from two independent experiments.

