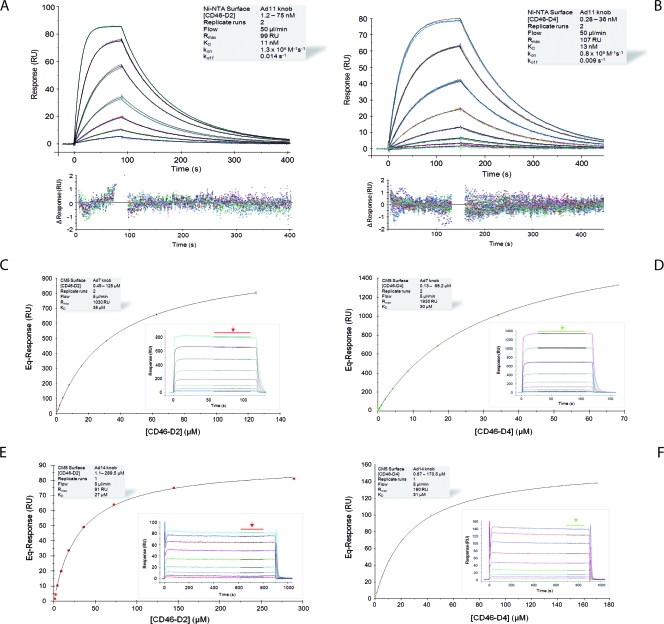
FIG. 2.
Kinetic and equilibrium SPR analyses of CD46-knob interactions. (A and B) Kinetic analysis of CD46-D2 (A) and -D4 (B) binding to immobilized Ad11 knobs. Double-referenced sensorgrams (shown in color) are overlaid with fits of a “1:1 binding with mass transfer” model (black lines) on top over the corresponding residual values showing the kinetic-fit range and absolute deviation (Δ) of data points from curve fit values. (C to F) Equilibrium analysis of CD46-D2 (C and E) or -D4 (D and F) binding to immobilized Ad7 (C and D) and Ad14 (E and F) knobs. Equilibrium (Eq) response values (colored squares) are plotted against CD46 concentrations and fitted to a “1:1 Langmuir isotherm” model (black line). The insets show overlay plots of double-referenced sensorgrams (shown in color) with overlaid average fits (black lines; indicated by arrows) of equilibrium response values. The shaded boxes contain additional information about setup details and measured parameters.

