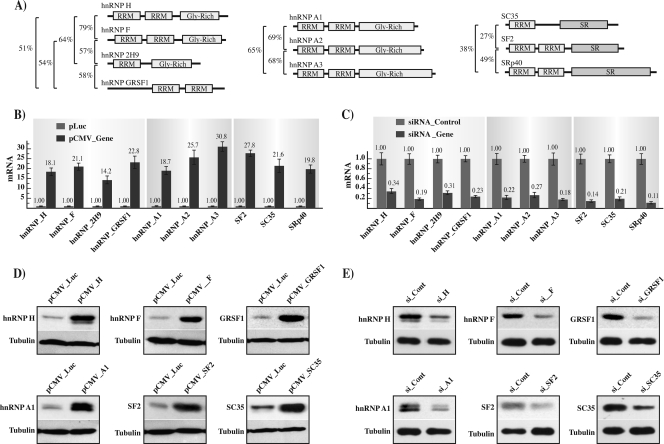
FIG. 2.
(A) Schematic representation of the proteins analyzed. Proteins are grouped in three families, hnRNPs H and A/B and SR (from left to right). Major domains are indicated as follows: RNA recognition motif (RRM), glycine rich, SR (serine/arginine rich). The relative homology percentage among the different members of each protein family is indicated on the left. (B) hnRNP and SR proteins overexpression. The graph indicates the quantification by qPCR of the mRNA coding for the different hnRNPs and SR proteins in the HEK 293 cells transfected with the control plasmid (pLuc) or the expression plasmid (pCMV_Gene; “Gene” represents the gene indicated at the bottom of the graph). (C) siRNA downregulation. The graph indicates the quantification by qPCR of the mRNA coding for the different hnRNPs and SR proteins in the HEK 293 cells treated with the control siRNA (siRNA_Control) or gene-specific siRNA (siRNA_Gene; “Gene” represents the gene indicated at the bottom of the graph). In the overexpression and siRNA assays, cells were cotransfected with the pEGFP-N1 plasmid, and EGFP mRNA was utilized as a normalizing control in all qPCR assays. (D) The panels show the amount of protein present in the cells transfected with the various expression vectors in comparison with that in cells transfected with the control pLuc vector. (E) The panels show the amount of protein present in the specific siRNA-treated cells in comparison with that in siRNA_Control-treated cells.

