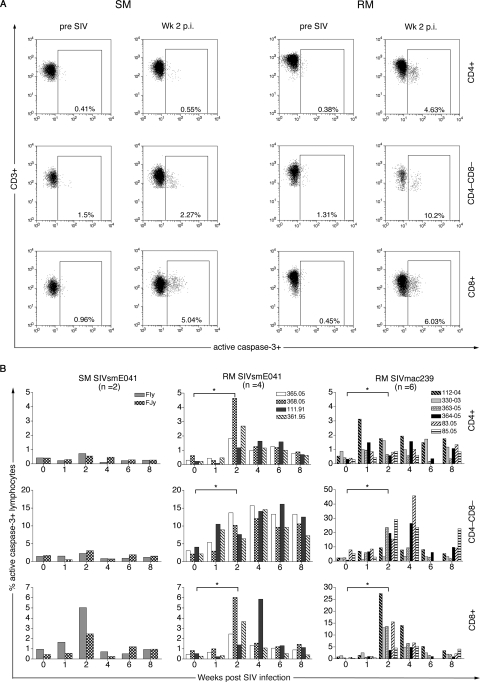
FIG. 2.
Differential ex vivo T-lymphocyte apoptosis in peripheral blood in SM and RM following SIV infection. (A) Representative flow data of active caspase-3 staining of CD4+ (top), CD4−CD8− (middle), and CD8+ (bottom) T lymphocytes before and after SIVsmE041 infection for one SM and one RM (B) Kinetics of active caspase-3 expression in peripheral CD4+ (top), CD4−CD8− (middle), and CD8+ (bottom) T lymphocytes in two SIVsmE041-infected SM, four SIVsmE041-infected RM, and six SIVmac239-infected RM in the first 8 weeks after SIV infection. Data on individual animals in each group are shown. Asterisks denote P values of <0.05 for comparison between week 0 and week 2 time points determined by the two-tailed paired t test. p.i., postinfection.

