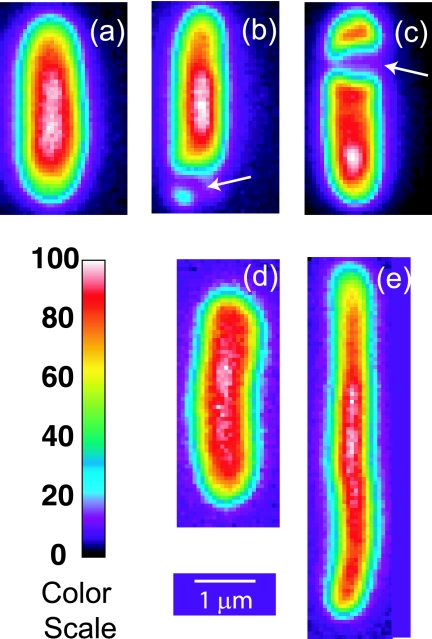
FIG. 1.
Prebleach images of representative cells. A false-color scale is given at the lower left. Cells a, b, and c were grown in 0.28 osmol; cell a was resuspended in isosmotic buffer, while cells b and c, which exhibit visible PSs (arrows), were upshifted from growth at 0.28 osmol to 0.85 osmol. Cells d and e exhibit the normal and thread-like morphologies observed for growth at 1.45 osmol.

