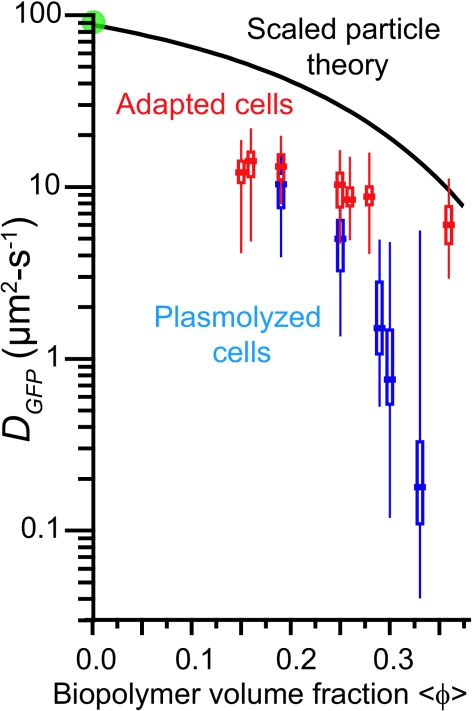
FIG. 3.
DGFP versus 〈φ〉 for cells adapted to growth at increasing osmolalities (red symbols) and for cells plasmolyzed to higher osmolalities (blue-gray symbols). For each condition, the horizontal bar represents the median value ( ); the rectangle denotes the δDIQR (the range of the central 50% of values); and the vertical line denotes the complete range of the distribution. See Tables 1 and 2. Green circle, DGFP in buffer. Black curve, SPT prediction for GFP diffusion in a homogeneous cytoplasm of monomeric, hard-sphere crowders of two sizes mimicking small globular proteins and ribosomes, as described in the text. The adjustable parameter Δr/RGFP is chosen as 1.3 based on fits to protein diffusion data in vitro. See the text.

