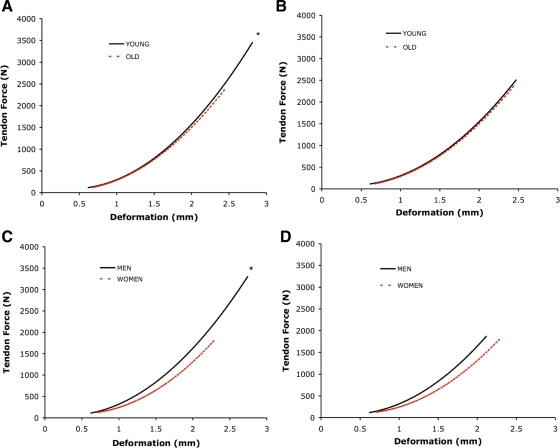
Fig. 4.
Mean tendon force (y-axes; in N) vs. deformation curves. Data fitted with 2nd-order polynomial regression. Slope of the line equals tendon stiffness (N/mm). A: young vs. old at maximal tendon force. *P < 0.05, force and deformation, young > old; for deformation P = 0.05, young > old. B: young vs. old at normalized tendon force. C: men vs. women at maximal tendon force. *P < 0.05, force, deformation, and stiffness, men > women. D: men vs. women at normalized tendon force.

