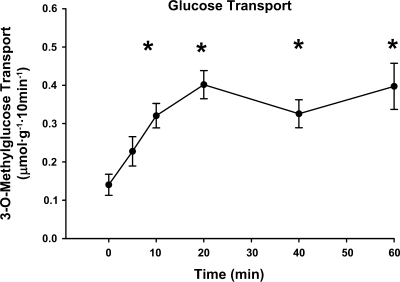
Fig. 5.
Time course for contraction-stimulated glucose transport in isolated rat epitrochlearis muscles. The values at 0 min are from rested muscles. The rate of glucose transport was measured using 3H-labeled 3-O-methylglucose (3-MG). Values are means ± SE; n = 12–18 per group. Post hoc analysis: *P < 0.05 vs. basal.

