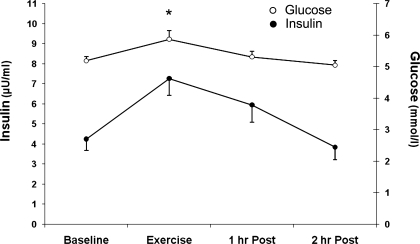
Fig. 3.
Blood insulin and glucose concentrations. Blood samples were obtained 4 times at regular intervals (approximately every 10 min.) during each period of the study: baseline, exercise, 1 h postexercise, and 2 h postexercise. Venous insulin and glucose concentrations. Data are expressed as means ± SE. *P ≤ 0.05 vs. baseline.

