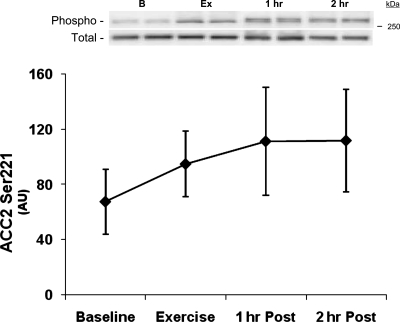
Fig. 4.
ACC phosphorylation. Data are from each biopsy taken at baseline, immediately following resistance exercise (Exercise), 1 h following exercise, and 2 h following resistance exercise. Data are expressed as means ± SE. *P ≤ 0.05 vs. baseline (n = 7). Insets: representative blots for each time point: baseline (B), exercise (Ex), 1 h postexercise (1 h), and 2 h postexercise (2 h).

