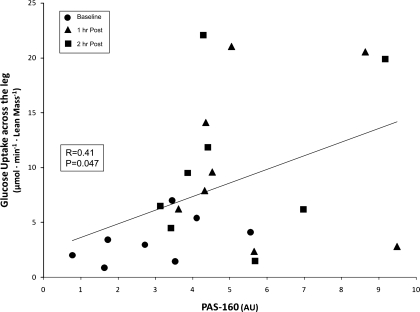
Fig. 6.
Correlation of PAS phosphorylation and glucose uptake across the leg. Data points from baseline and 1 h and 2 h post-resistance exercise are included in the Pearson product-moment correlation (24 data points). PAS phosphorylation was positively correlated with glucose uptake across the leg (R = 0.41; P ≤ 0.05).

