FIG. 2.
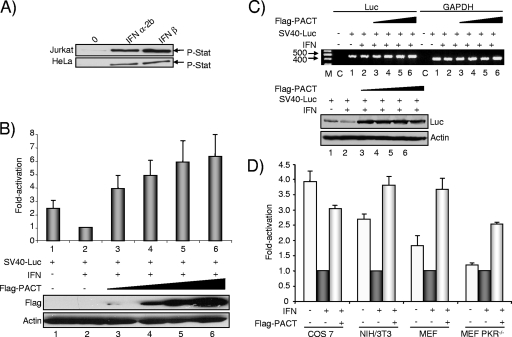
PACT overexpression reverses IFN-induced inhibition of SV40 promoter expression in HeLa, COS-7, NIH 3T3, and MEF cells. (A) Jurkat and HeLa cells are activated by IFN treatment. Jurkat or HeLa cells were incubated without IFN (0) or with 1,000 U/ml of IFN-α2b or IFN-β as indicated. Fifty micrograms of total protein was separated by SDS-PAGE and blotted with anti-P-Stat1 antibodies. (B) PACT reverses IFN-mediated SV40-Luc repression in HeLa cells. HeLa cells were transfected with 0.8 μg of SV40-Luc and 0.1 (lane 3), 0.2 (lane 4), 0.4 (lane 5), of 0.8 (lane 6) μg of pCMV-Flag-PACT. pCMV-Flag was added to reach the same amount of transfected DNA. Cells (lanes 2 to 6) were stimulated with 100 U/ml IFN-β as indicated. The Luc level was normalized to 1 for cells treated with IFN. Fifty micrograms of whole-cell extracts (lanes 1 to 6) was subjected to SDS-PAGE and blotted with anti-Flag and antiactin antibodies as indicated. (C) PACT mildly increases the RNA level of an SV40-Luc reporter gene inhibited by IFN. Cells were transfected as described in panel B (lanes 1 to 6). RT-PCR (top) was performed on RNA extracted from the transfected cells as indicated in Materials and Methods. Lane M, molecular weight markers; lane C, control with no cDNA. The Luc- and the GAPDH-amplified DNAs are indicated on top. Whole-cell extracts (200 μg) were subjected to SDS-PAGE and blotted (bottom) with anti-Luc and anti-actin antibodies as indicated. (D) PACT reverses IFN-mediated SV40-Luc repression in COS-7, NIH 3T3, and MEF cells. COS-7, NIH 3T3, MEF, and PKR−/− MEF cells were transfected as described in panel B with 0.8 μg of SV40-Luc plasmid (all) and 0.2 μg of pCMV-Flag-PACT (Flag-PACT) as indicated. Cells were treated with 100 U/ml IFN-β as indicated. The Luc level was normalized to 1 for cells treated with IFN (black bars) compared to untreated cells (open bars). The activation is calculated as the ratio between Luc expression in the presence of PACT versus in the absence of PACT in the IFN-treated cells (gray bars). Graphs represent the averages of three to five independent transfections ± standard error of the mean.

