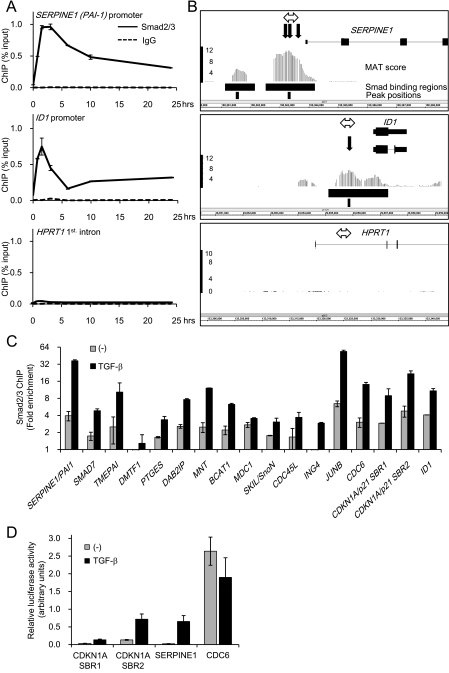
FIG. 1.
Identification of Smad2/3 binding sites in promoters of human genes with HaCaT cells. (A) Time course of Smad2/3 binding to known target promoters. HaCaT cells were treated with TGF-β, formalin fixed at the indicated times, and harvested. Chromatin precipitated by anti-Smad2/3 or control IgG was reverse-cross-linked, and the obtained genomic fragments were quantified by real-time PCR. Data were normalized by input DNA. IgG, mouse control IgG1. Error bars represent standard deviations. (B) Comparison of obtained ChIP-chip signals with published Smad binding positions at promoters of the known target genes of TGF-β. Obtained probe signals were transformed to MAT scores for each position, and peak signal positions were determined from the significant Smad binding regions in the SERPINE1 or ID1 promoter. The HPRT1 intronic region is shown as a control. The upper black bars represent significant Smad binding regions, and the lower bars indicate peak positions. The bold black arrows are reported Smad binding positions. The double-headed arrows are positions of amplicons analyzed in panel A. (C) Validation of Smad2/3 binding by ChIP-qPCR. HaCaT cells were treated as for panel A, and Smad2/3-bound DNA at 1.5 h after TGF-β treatment was quantified by real-time PCR. Values are presented as n-fold enrichment over the mean value of control Smad2/3 ChIPs (HPRT1, HOXA13, and KIF5B promoters). SBR1/2, Smad binding region 1/2 (see Fig. 5A). Error bars represent standard errors. (D) Validation of the TGF-β-induced transcriptional activity of identified Smad2/3 binding regions. HaCaT cells were transfected with the luciferase reporter constructs as indicated and stimulated with TGF-β. Error bars represent the standard errors.

