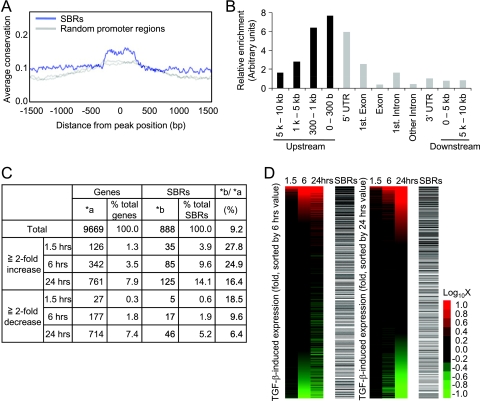
FIG. 2.
The SBRs are enriched near transcription start sites and frequently found in upregulated genes. (A) Smad binding regions are evolutionarily conserved. The average conservation of Smad binding regions was determined by CEAS analysis tools (23) by using phastCons score (48) information for analysis. As a control, two sets of randomly selected promoter regions were analyzed and plotted as gray lines. (B) Smad binding regions are enriched near transcription start sites. The distribution of the peak positions of Smad binding regions relative to the nearby RefSeq gene was determined, and results were normalized by the distribution of probes designed for the array used. UTR, untranslated region. (C) Summary of expression array results compared to ChIP-chip analysis. A total of 9,669 genes that had values of more than 100 at at least one time point for one of their probes (n = 14,754) were used for the following analysis. Upregulated or downregulated genes were determined compared to 0 h values. The positions of peak signals of SBRs relative to the nearby RefSeq genes were first determined, and regions more than 5 kb upstream from the transcription start site and downstream from the first intron were filtered out. (D) Smad binding regions were enriched at upregulated genes. Probe signals were sorted by the change in expression at 6 (left) or 24 (right) h with TGF-β stimulation and compared to the presence of SBRs (black bars). Changes in expression were visualized by heat mapping.

