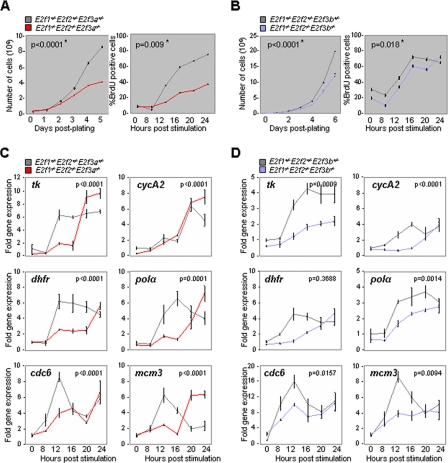
FIG. 2.
E2f3a and E2f3b are sufficient to support cellular proliferation. (A and B) (Left panels) Growth curves of control (gray), E2f1−/− E2f2−/− E2f3a−/− (red), and E2f1−/− E2f2−/− E2f3b−/− (blue) MEFs. Passage 2 MEFs with the indicated genotypes were plated in duplicate and counted every day for 6 days. (Right panels) BrdU incorporation in control (gray), E2f1−/− E2f2−/− E2f3a−/− (red), and E2f1−/− E2f2−/− E2f3b−/− (blue) MEFs. (C and D) RT-PCR analysis of E2F target gene expression from MEFs harvested as described for panels A and B. The statistical analyses for proliferation assays, BrdU incorporation, and gene expression were performed as described for Fig. 1. Three independent experiments were performed for proliferation assays, BrdU incorporation, and gene expression. The P value comes from all three independent experiments.

