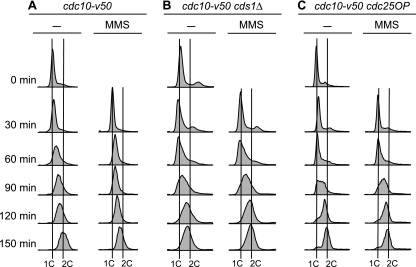
FIG. 1.
Assay for the MMS-induced S-phase damage checkpoint. Cells bearing the cdc10-v50 mutation were arrested in G1 by incubation at 35°C. At 0 min, the cells were released into the cell cycle by reducing the temperature to 25°C. Columns labeled MMS show results for cells treated with 0.015% MMS at 0 min. Samples were collected at the indicated times and analyzed by flow cytometry. (A) Wild-type (cdc10-v50) cells retarded their progression through S phase when treated with MMS. (B and C) In contrast to wild-type cells, cds1Δ (B) and cdc25OP (C) cells failed to slow their progression through S phase upon DNA damage. Because fission yeast cells become elongated when cell cycle arrested, which affects their optical properties, the positions of 1C and 2C peaks cannot be determined from log-phase flow cytometry profiles. We determined the positions of the 1C lines from the position of the major peak at 0 min, modified by the position of the major peak at 30 min in the case (cds1Δ cells) (B) where the 30-min peak was left of the 0-min peak. The positions of the 2C lines were determined by the position of the rightmost of the major peaks (without and with MMS) at 150 min. In all panels, the distances separating the 1C lines from the 2C lines for the untreated and MMS-treated samples are identical. That the untreated cds1Δ cells were indeed at the end of S phase at the 150-min time point, despite showing a peak slightly to the left of the 2C line, is evident from the 2D gels in Fig. 3 and 5B, where the RIs from the untreated cells were consistently at background level at 150 min.

