FIG. 8.
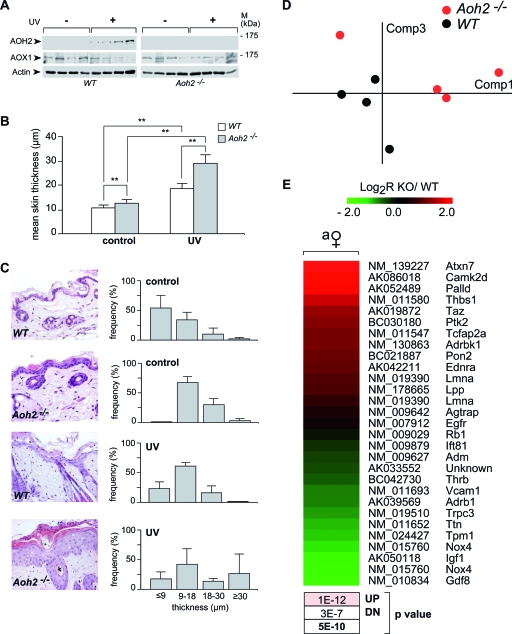
Induction of AOH2 by UVB irradiation and epidermal hypertrophy in untreated and UVB-treated Aoh2−/− mice. Four WT or Aoh2−/− female mice per each experimental group were mock treated (control) or treated by UVB light irradiation on the dorsal area of the skin for 4 days, as described in Materials and Methods. (A) Skin biopsy samples of similar volumes were obtained from the same dorsal areas of the skin and homogenized. Homogenates (20 μg) were subjected to Western blot analysis with anti-AOH2, anti-AOX1, and anti-β-actin antibodies as indicated. Please note that in the Western blot shown, the lack of AOH2 signal in basal conditions is merely due to the low amount of total protein extract loaded. (B) The bar graph illustrates the results obtained on the thickness of the epidermal layer of the skin after serial morphometric analysis of the slides (25 fields per animal). **, significantly different (Student's t test, P < 0.01). M, molecular mass. (C) The micrographs show representative fields of the skin obtained from untreated (control) and UVB-irradiated (UV) WT or Aoh2−/− animals. The magnification of photographs is ×200. The right bar graphs show the distribution of the epidermal thicknesses after stratification in four discrete percentile classes. Each value is the mean ± SD for four animals. (D) Gene expression pattern of the tissue hypertrophy category (128 genes, 255 probes) in the skin. PCA of the VSN intensity values (means centered) in the eight samples. Comp, component. (E) Heat map of the genes significantly changed by AOH2 deletion (P < 0.05). The P values (upregulation[UP], downregulation[DN], or general significance in boldface) reported below the heat map refer to the GSEA, as described in Materials and Methods. This analysis was performed to demonstrate the prevalence of an increase in the expression of “hypertrophy” genes (reddish box). Symbols: ♀, female. Abbreviations: a, adult; y, young; KO, knockout.

