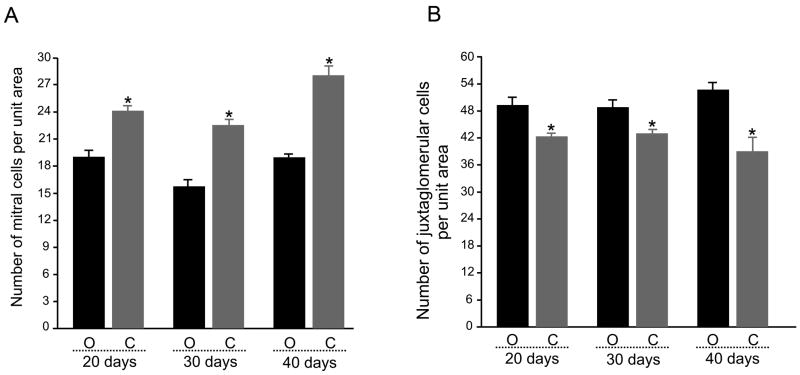
Figure 2.
Bar plot of the mean number (per 93,500 μm2) of (A) mitral cells and (B) juxtaglomerular cells in a population of OBs contralateral to the naris-occlusion (O, open) versus that for OBs ipsilateral to the naris-occlusion (C, closed). Data represent mean +/− standard error of the mean for three sections analyzed across quadrants (dorsal, ventral, medial, lateral) acquired from 15 animals in each of three occlusion durations. * = Significantly-different by mixed-block factorial design ANOVA, Bonferoni’s, α ≤ 0.05.

