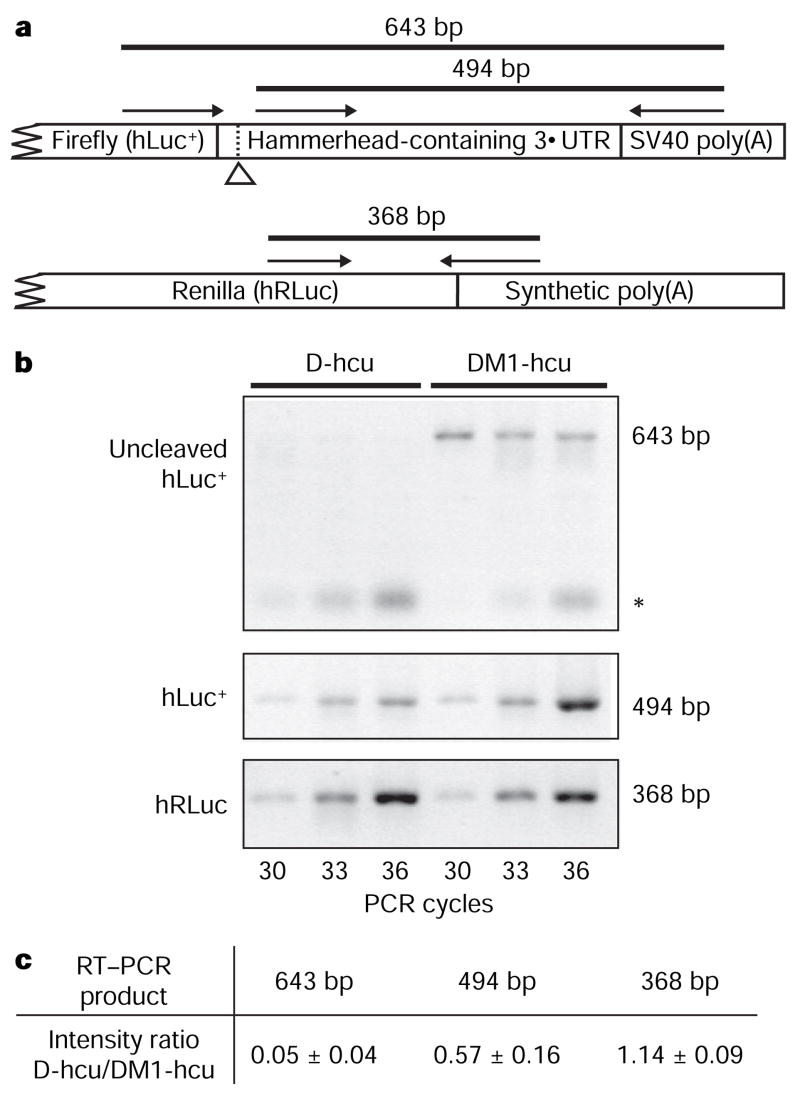
Figure 4. RT–PCR analysis of the in vivo expression products.
a, Schematic of the relative positions of the RT–PCR primers. The hammerhead-specific cleavage site is indicated by an open arrowhead. The 368 base pair (bp) product acts as the internal control for transfection efficiency and the extent of transcription. b, RT–PCR of RNA isolated from NIH 3T3 cells that have been transfected with pD-hcu or pDM1-hcu. The asterisk indicates nonspecific PCR products. c, Quantification of the difference in PCR product intensity between D-hcu and DM1-hcu. The product intensity was used to determine the ratio of D-hcu/DM1-hcu at each listed cycle. Each value represents the mean ± s.d. of intensity ratios from three listed cycles.

