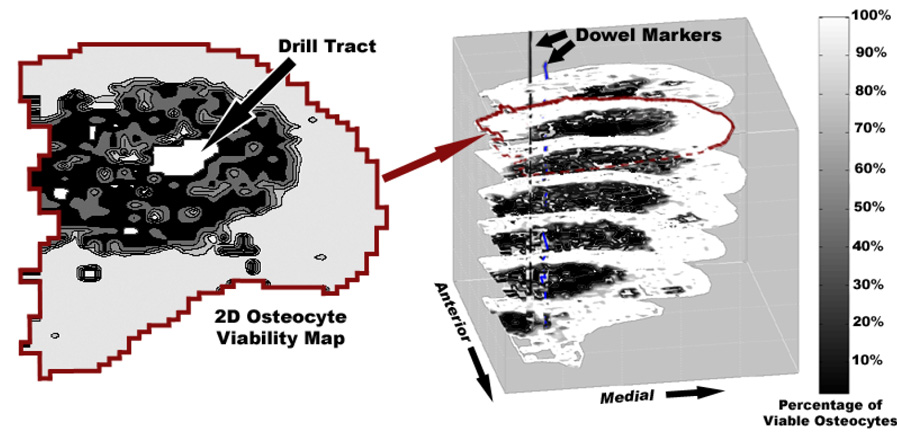
Figure 4.
Illustration of the 3D viability mapping assembly. Two-dimensional maps of osteocyte viability were stacked in 3D to get a volumetric data set of osteocyte viability. The lesion (shown in dark) edge was determined relative to the drill tract (white space in the center of the necrotic lesion).

