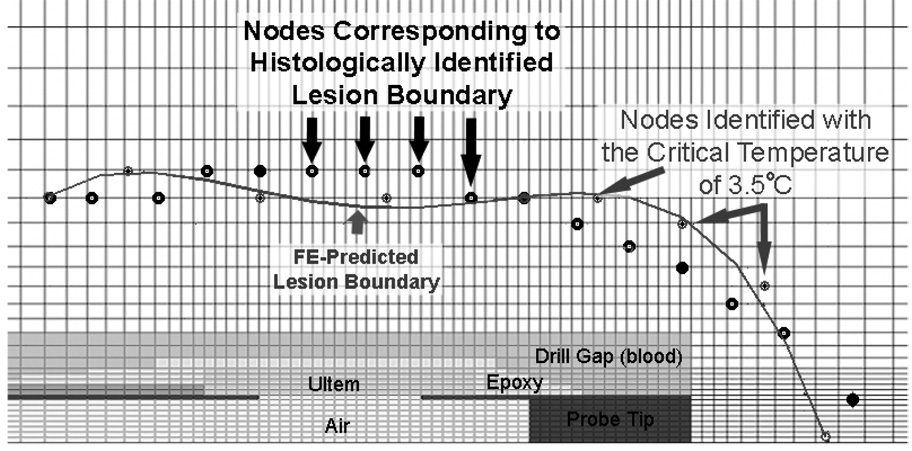
Figure 7.
Prediction of lesion boundary in the −30°C trial by identification of the critical isotherm at the nodes in the FE model. The nodes most closely corresponding to the histological lesion boundary are circled in black, and the nodes identified by the critical temperature are circled in gray. The lesion boundary is a 4th order polynomial fit to nodes with the critical isotherm.

