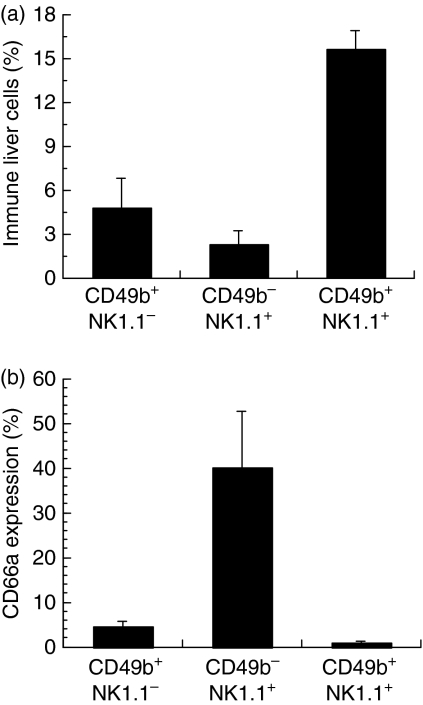
Figure 3.
CD66a expression by liver natural killer (NK) subpopulations. Pooled liver cells from groups of five or six C57/BL6 mice were analysed by flow cytometry for CD49b, NK1.1 and CD66a expression. (a) Proportion of CD49b+ NK1.1−, CD49b− NK1.1+ and CD49b+ NK1.1+ cells. (b) Expression of CD66a by each NK subpopulation shown in (a). Results are shown as mean ± SEM of three independent experiments.

