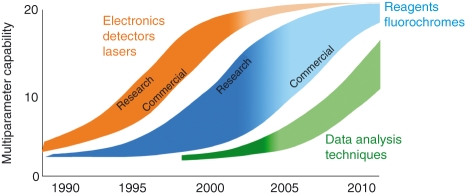
Figure 2.
The development of multiparameter flow cytometry. The width of each curve represents the time lag between research discovery and commercialization, while the colour gradient indicates the degree to which each technology has been broadly adopted. For example, advances in hardware (electronics, detectors and lasers) largely occurred in the late 1990s, leading to 20-parameter instrumentation. Instrumentation first developed in 2001 is now widely available; therefore, the colour gradient of this curve is mostly dark. Advances in reagents lagged somewhat behind, and the period between research discovery and commercialization was much longer than for instrumentation. Notably, a number of monoclonal antibody–fluorochrome conjugates are not yet commercially available. Data analysis techniques in the larger flow community remain nascent and represent the area where the greatest need for development remains.

