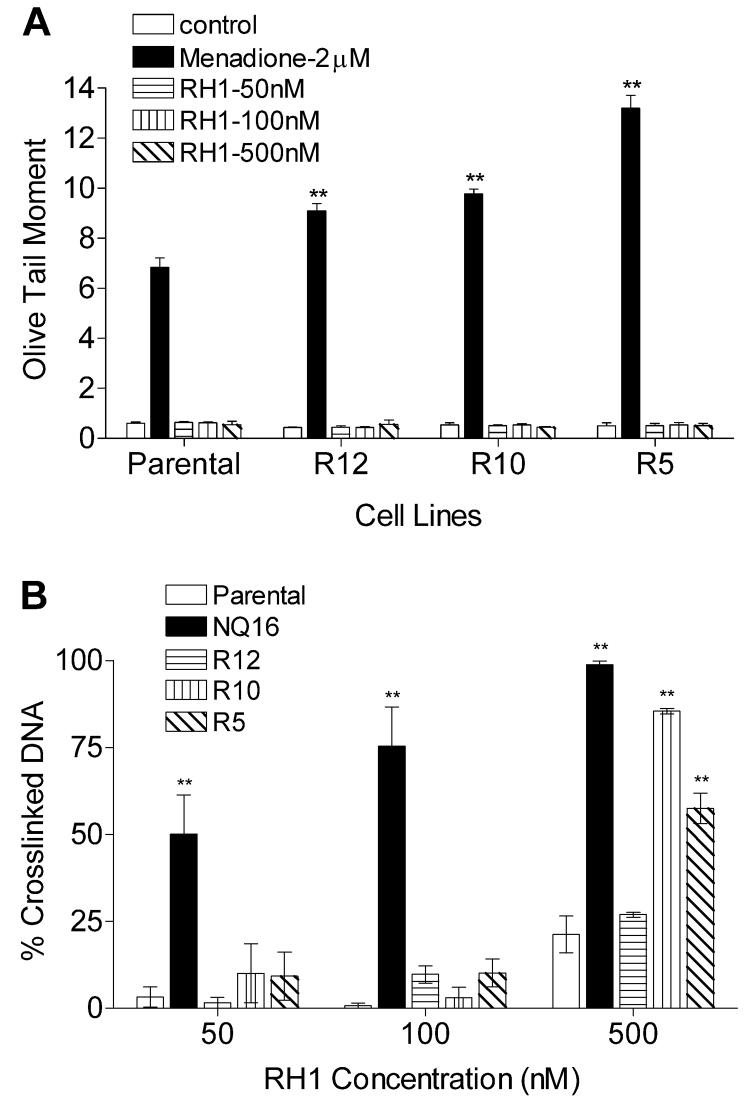
Figure 3. Formation of DNA cross-linking and single strand breaks in parental and P450R transfected MDA468 cells following RH1 treatment.
DNA cross-linking and single strand breaks were measured by comet assay following 2 h treatment with RH1. (A) DNA single strand breaks were expressed as the olive tail moment. Menadione treatment (2 μM) was included as a positive control. (B) DNA cross-linking was expressed as the percentage decrease in comet tail moment in RH1 treated cells comparing to untreated H2O2 (200 μM for 20 min) control. NQ16 cells were included as a positive control. The percent of DNA in comet tail was also recorded and listed in Table S2. Results are expressed as the mean ± standard deviation of three separate determinations. ** Significantly different from parental cells with same drug treatment, p < 0.01.

