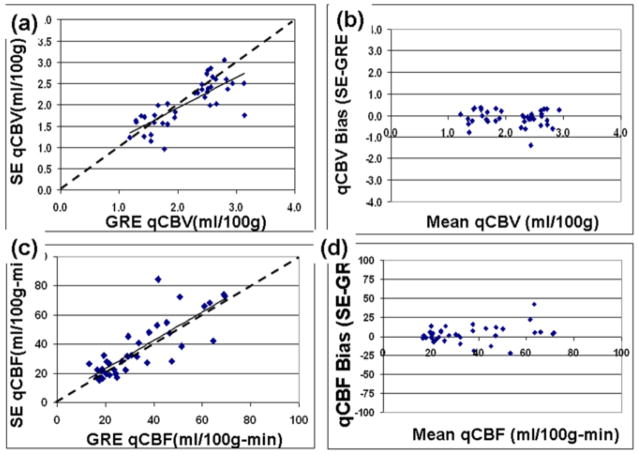
Figure 3.
Scatter plots comparing perfusion quantification from SE-EPI and GRE-EPI acquisitions in 19 patients. Correlation analysis of (a) cerebral blood volume (qCBV), and (c) cerebral blood flow (qCBF) are plotted separately. The resulting correlation fit is show as a solid line, a line of unity (y=x) are shown as dotted lines. The corresponding Bland-Altman plots (b,d) are also shown.

