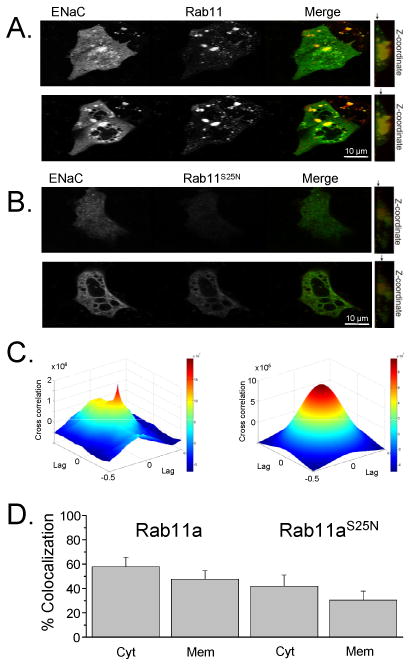
Fig. 3.

Rab11a colocalizes with ENaC. (A, B) mpkCCDc14 cells were transiently transfected with eCFP-tagged α-, β- and γ-ENaC subunits and wild type (A) or dominant negative (B) DsRed-Rab11. In the merged picture, the colocalization of the 2 proteins is depicted in yellow. Cytoplasm (bottom) and membrane (up) fractions are shown. The arrows on the z-cross-section (right) point to a slice location from where the representative images where taken. (C) Image cross-correlation analysis. Fitting the raw data (left) with an analytical correlation function allowed to calculate the correlation coefficient (ρ12) and the mean number of colocalized particles within a confocal beam area (right). (D) Summary graph of the mean ± SE of the rate of ENaC colocalization with wild type (left columns) and dominant negative (S25N) Rab11 (right columns) from cytosol (Cyt) and membrane (Mem) fractions.
