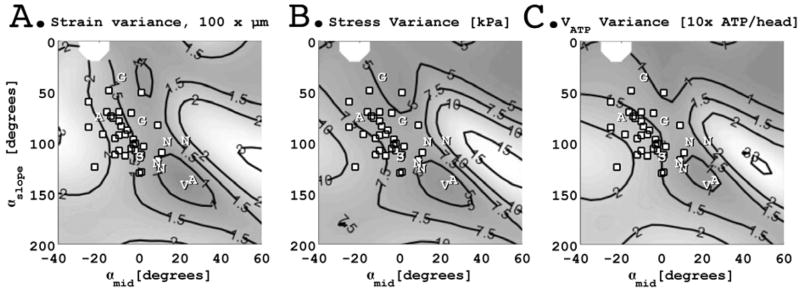
Figure 3.
Direct comparison of myofiber inclination angles obtained in the ovine left ventricle (white dots) and the simulation results of Vendelin et al (Vendelin, Bovendeerd et al., 2002) plotted in the space of myofiber angle transmural slope (αslope, degrees) and midwall myofiber angle (αmid, degrees). Vendelin’s approximate optimal myofiber geometry is shown as a ”v”. Results extracted from Streeter (Streeter, Spotnitz et al., 1969)(“S”), Ashikaga (Ashikaga, Omens et al., 2004)(“A”), Greenbaum (Greenbaum, Ho et al., 1981)(”G”), and Nielsen(Nielsen, Le Grice et al., 1991) (“N”) are also shown. Our results from the ovine left ventricle demonstrate a range of myofiber geometries all of which deviate from the optimal results predicted by Vendelin et al. Measured myofiber geometries in the ovine left ventricle, however, do fall within a relatively narrow range of spatial variance in strain, stress, and ATP consumption.

