
Figure 8.
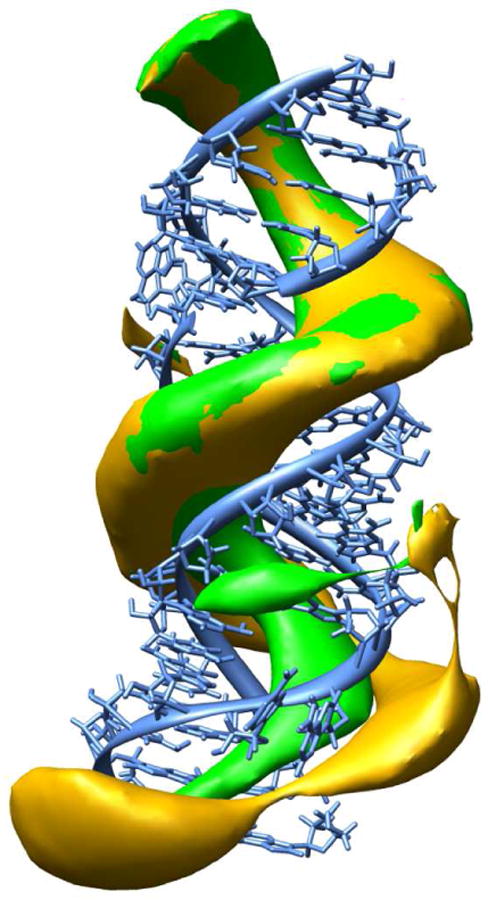
BD derived density maps of paromomycin molecules around the RNA fragment. Green: constant density surface generated when both binding pockets were empty; yellow: constant density surface when one binding pocket (lower half of the picture) was permanently occupied by the second antibiotic. Surfaces are constructed from points describing the positions of the geometric center of the ligand.