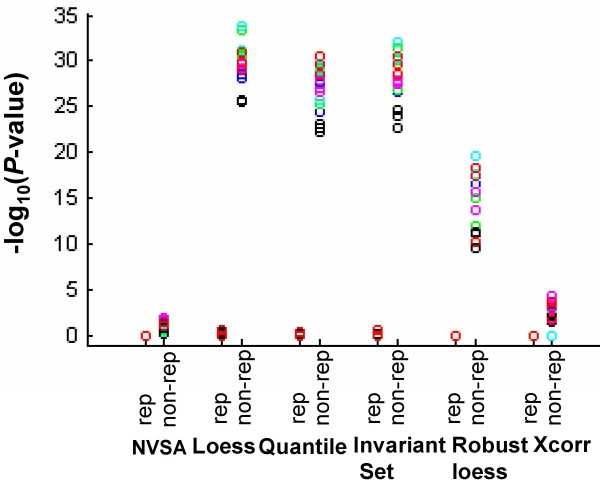
Figure 6.
Kolmogorov-Smirnov tests for agreement of normalization in the analysis of Golden Spike data. Assessment of statistical difference (Kolmogorov-Smirnov tests) between normalized intensities computed via all-gene approach and normalized intensities via non-DEG genes with the same normalization method. All normalized intensities were calculated relative to a reference array. Each one of six arrays was chosen as a reference array. A total of 12 replicate array pairs and 18 non-replicate arrays pairs could be formed. Blue, green, cyan, magenta, black, and red mark the reference array C1, C2, C3, S1, S2, and S3, respectively. Difference in two normalization curves is statistically significant when P value < 0.01.

