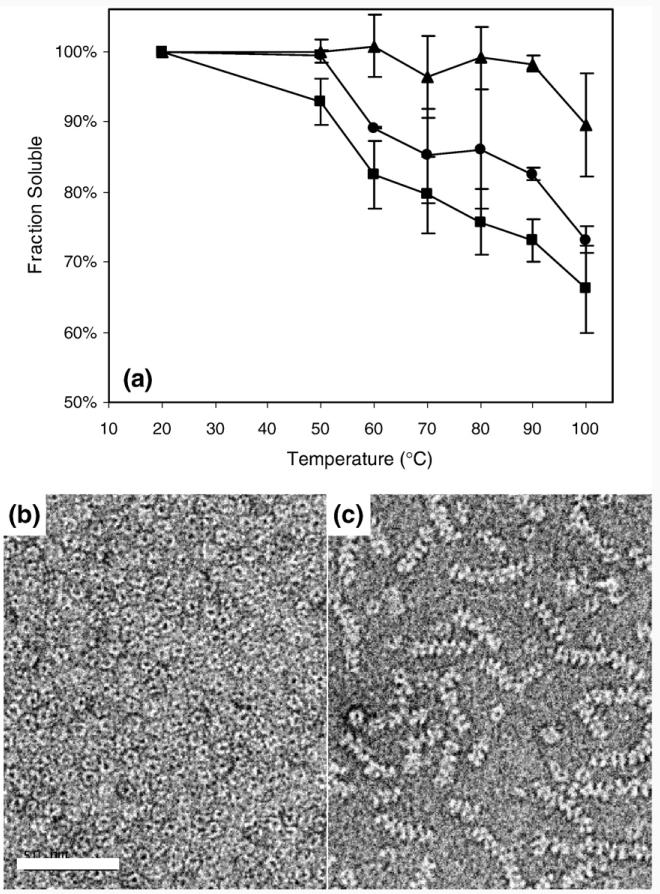
Fig. 1.
(a) Aggregation of Aacpn10del-25 as a function of temperature and peptides. The fraction of soluble protein after 20 min of incubation is plotted versus incubation temperature. Circles indicate Aacpn10del-25;triangles, Aacpn10del-25+T; squares, Aacpn10del-25+T-Scramble. (b, c) Negatively stained images of Aacpn10del-25 with T (b) and T-Scramble (c). The scale bar represents 50 nm. At these conditions, full-length Aacpn10 does not stack into fibrillar aggregates (not shown).

