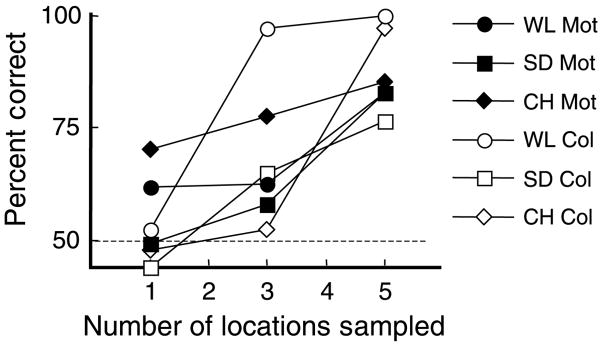
Figure 10.
Accumulation for individual features. The percent correct report of the color (outline symbols) or motion (filled symbols) is shown as a function of the number of locations sampled for 3 observers (WL, circles; SD, squares; CH, diamonds). Accumulation is seen in all cases but more so for color.

