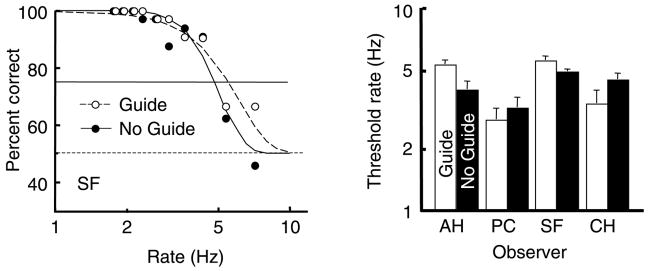
Figure 12.
Threshold rate for reporting target orientation (mirror versus normal). Left panel: Accuracy data for one observer as a function of alternation rates shown on log scale. Guide data, open symbols and Guide fit, dashed line; No Guide data, black circles and No Guide fit, solid line. Dashed horizontal line shows chance level; solid horizontal line shows 75% threshold level. Right panel: 75% threshold rates on log scale for 4 observers. White bars for Guide conditions and black bars for No Guide. Thin vertical lines show +1 SE.

