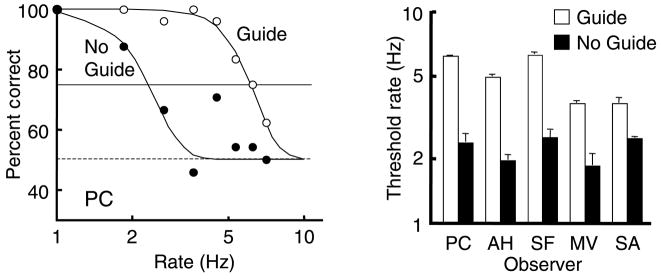
Figure 3.
Accuracy of color–motion report. Left panel: Accuracy for guide and no-guide sessions is shown for one observer, PC, as a function of alternation rate (plotted on a log scale). Dashed horizontal line is the chance level. Solid horizontal line is the 75% threshold criterion. Right panel: Threshold rates are shown (on log scale) for 5 observers with white bars for the thresholds with moving attention and black bars for the thresholds with stationary attention (no guide). Vertical lines above the bars show +1 SE. Threshold rate for reporting correct pairing of color and motion is 3.6 to 6.2 Hz when following the moving target (white bars). Threshold is only 1.8 to 2.5 Hz when attending to a stationary location (black bars).

