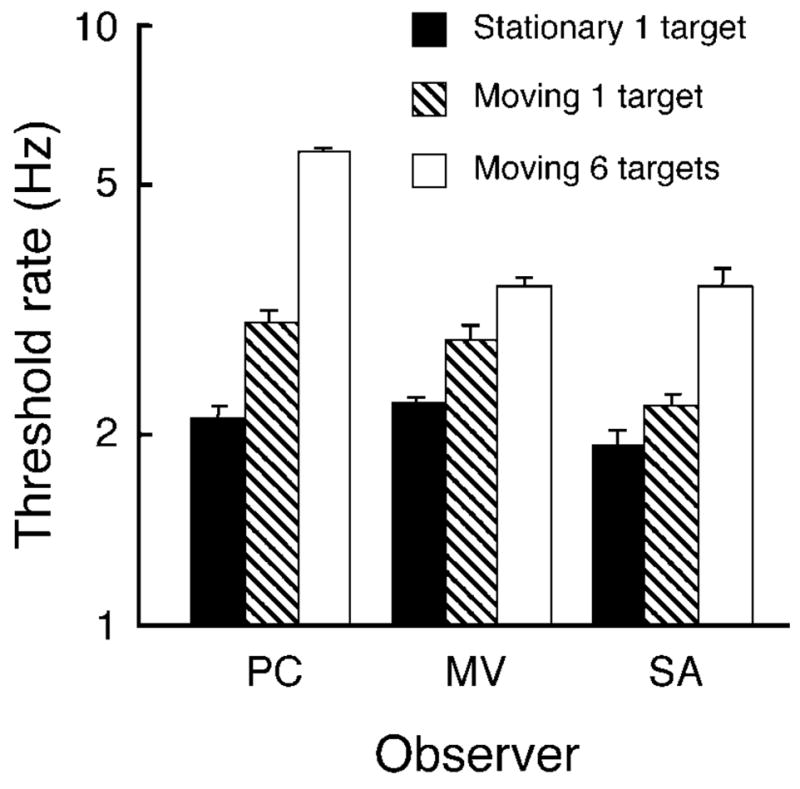
Figure 7.

Single-sample control. Solid bars show the thresholds for a single target encircled by a guide ring with attention held at the target location. When attention follows a moving guide and passes through the same single target, threshold rates are higher (striped bars). For comparison, thresholds of these observers from Experiment 1 are shown for moving attention (sampling 6 target locations) with outline bars. Vertical lines above the bars show +1 SE.
