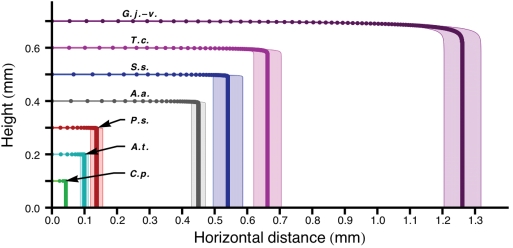
Figure 3. Model spore trajectories for seven basidiomycetes species based on measurements of spore size and launch speed and using Stokes model of viscous drag.
To aid visualization, spores were launched horizontally from arbitrary heights. Positions of spores at 50 µs intervals indicated by dots. The variation in horizontal range predicted from the measured variation in launch speeds (±standard error; Table 1) for each species is represented by the shaded region around each trajectory. Species initials: G.j.-v., Gymnosporangium juniperi-virginianae; T.c., Tilletia caries; S.s., Sporobolomyces salmonicolor; A.a., Auricularia auricula; P.s., Polyporus squamosus; A.t., Armillaria tabescens, and C.p., Clavicorona pyxidata.

