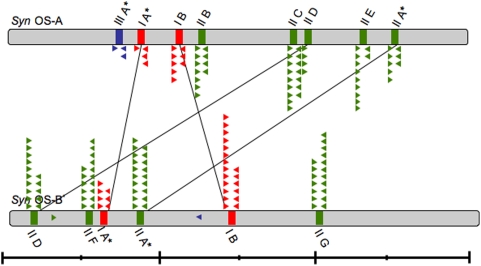
Figure 1. Schematic location of CRISPR loci on Syn OS-A OS-B genomes.
Bars indicate the relative positions of the Type I (red), Type II (green) and Type III (blue) CRISPR loci on the genomes of Syn OS-A (top) and Syn OS-B′ (bottom). Asterisks indicate CRISPRs with an associated cas operon. CRISPRs within syntenic genome blocks are connected with lines. Approximate location and direction of the mapped clone-mates of CRISPR containing clones are show as triangles colored by the repeat type (as above). Two clones that mapped to a location on a reference genome that lacks a CRISPR array are shown within the genome box. Line below shows genome size (large ticks at 1 Mbp; small ticks at 0.5 Mbp).

