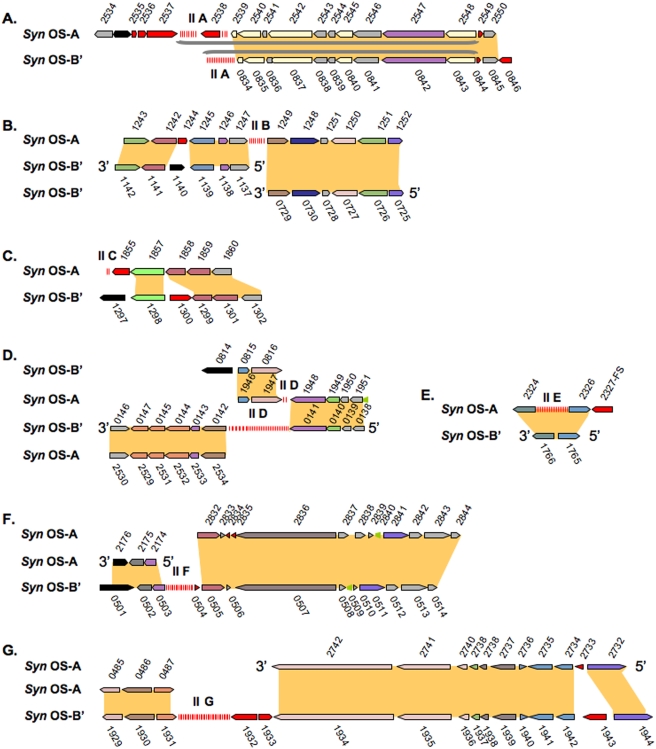
Figure 3. Type II CRISPR regions.
Homologous regions from Syn OS-A and Syn OS-B′ where one or both genomes has a Type II CRISPR locus are displayed. The CRISPR displayed is indicated by the panel letter (e.g. panel ‘A’ shows CRISPR-IIA, panel ‘B’ shows CRISPR-IIB, etc.) Figure conventions are as described in Figure 2. FS indicates a frameshift in the CDS. Additional details can be found in Table S3.

