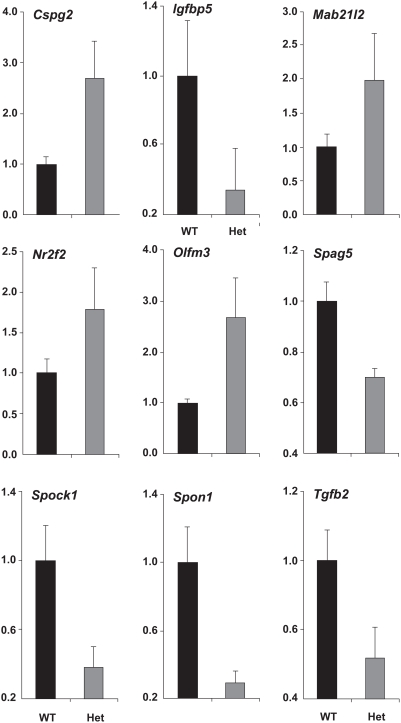
Figure 3. Verification of microarray results by qRT-PCR.
Relative expression levels of Cspg2, Igfbp5, Mab21l2, Nr2f2, Olfm3, Spag5, Sparc, Spon1 and Tgfb2 transcripts in wild type (WT, shown in black) and Pax6+/− (het, shown in grey) lenses were determined using qRT-PCR as described in Methods. Transcripts encoded by B2M, Hprt and Sdha, were tested as internal references [86], and all were found unchanged between the wild type and Pax6+/− lenses. The data are expressed relative to the unchanged expression level of B2M transcripts.

