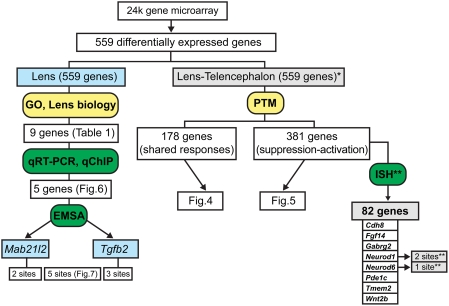
Figure 8. A schematic diagram of computational, analytic and confirmatory strategies.
The predicted Pax6-targets were validated by qRT-PCR, qChIP and EMSAs. The left arm of the diagram illustrates a strategy focusing on genes with established roles in the lens. The right arm shows a parallel strategy based on comparative expression profiling in lens and embryonic telencephalon. (*) represent data from [17], (**) represent data from [18]. In situ hybridization data, ISH; Pavlidis Template Matching, PTM; shared responses, S; suppression-activation, SA.

