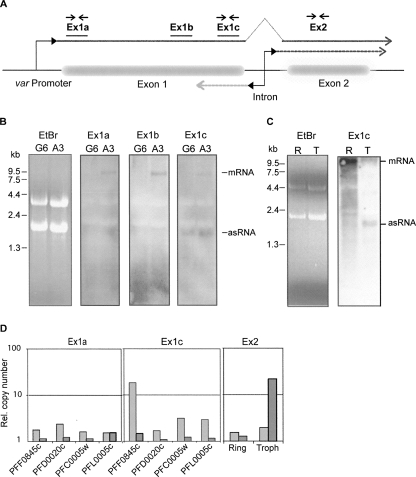
FIGURE 2.
Identification of exon 1 antisense RNA by Northern blot and quantitative RT-PCR. (A) The structure of a typical var gene is depicted schematically, and the relative positions of probes for Northern blot (solid lines) and PCR primer pairs (arrows) are indicated. Dashed lines represent the putative RNA transcripts originating in the intron in the sense (dark gray) and antisense (light gray) orientation. (B) Northern blot detection of RNA with specific probes for var gene PFF0845c. RNA was prepared from asynchronous cultures of NF54 clones A3 (PFF0845c “on”) and G6 (PFF0845c “off”). Major bands corresponding to var mRNA and antisense (as) transcripts are indicated. (C) Northern blot analysis using a PFF0845c exon 1 specific probe. RNA samples from synchronized A3 cultures were prepared at two different time points: in ring stage (R), ∼16 h after invasion and trophozoite stage (T), ∼36 h after invasion. For both B and C, ethidium bromide (EtBr) stained samples are included to show that approximately equal amounts of RNA were loaded in each lane. (D) var RNA transcripts in the transgenic DCJ line (Dzikowski et al. 2006) were detected by quantitative PCR using strand-specific cDNA as template created using either sense or antisense primers. Two primer pairs within exon 1 were specific for each of four var genes, while the primer pair within exon 2 recognized conserved sequences present in several var genes. The relative amounts of antisense and sense RNA, as determined by real-time PCR, are shown as light and dark gray columns, respectively. RNA was prepared from trophozoite stages (∼36 h post-invasion) of synchronous cultures, and for analysis with exon 2 primers additionally from ring stages (∼16 h).

