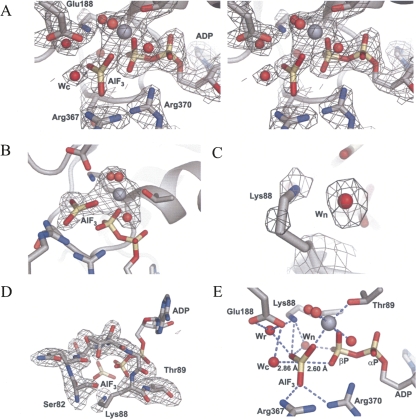
FIGURE 1.
Electron density maps of the ADP–AlF3 binding site. (A) Stereo view of a SIGMAA weighted 3Fo−2Fc electron density map contoured at 1.3 σ. (B–D) Fo−Fc omit maps, using simulated annealing started at 2000 K, contoured at 3.5 σ of either (B) the ADP–AlF3 and Mg2+ with its three coordinating waters omitted. (C) Lys88 and a nearby water molecule (wn) omitted. (D) motif I (also known as the P-loop or Walker A motif) omitted. (E) Coordination of AlF3 with selected side chains, ADP, and the catalytic water (wc), the relay water (wr), wn and three Mg2+ coordinating waters. All densities are displayed on top of complex I. Carbon atoms are colored gray, nitrogen atoms blue, phosphorous atoms wheat, and oxygen atoms red. The magnesium ion is shown in gray as a sphere that is larger than the red water molecules. The AlF3 is colored as the phosphates. This color scheme is used in all figures.

